SUBJECTS
GRADE
Show Results
Weather Pattern Compositions
Lesson Summary
- Gather weather data to use as musical notation.
- Create a music composition to represent weather.
Lesson Plan and Procedure
Lesson Key Facts
- Grade(s): K, 3
- Subject(s): Math, Music, Science
- Duration of lesson: 30-45 minutes, divided into sessions as necessary
- Author(s): Emily Soderborg
 Download
Note: This lesson is meant to start and end a project where students gather weather data. However, it can also be done by using weather records found online. In addition, this lesson can be taught in combination with another BYU ARTS Partnership lesson, Weather in the Seasons.
Introducing Weather
Teacher: You’re going to listen to some songs and poems today. As you listen, see if you can figure out what the pattern is connecting these songs. What do they have in common?
Select some of the following songs and poems to listen to or sing. (Feel free to include other songs and poems about weather that you know.)
Teacher: What pattern did you discover? Yes, all these songs have to do with the weather. What types of weather did we hear about? Do you know any songs or poems we could add to this list?
Teacher: Weather is the combination of things like sunlight, wind, snow, rain, and temperature in a particular region at a particular time. Weather happens over a short period of time. It can be measured every hour or each day in a particular region at a particular time. Weather describes the immediate changes in the atmosphere around us. The atmosphere is the air that surrounds Earth. The air that is around you right now is part of the atmosphere. Each day the weather changes. Sometimes the weather is hot. Other times we have snowstorms. Weather keeps you guessing. It makes every day an adventure. Whatever the weather is doing now, it could be doing something else in a matter of hours. Scientists measure these conditions to describe and record the weather to identify patterns over time. We get to be scientists and keep track of the weather too.
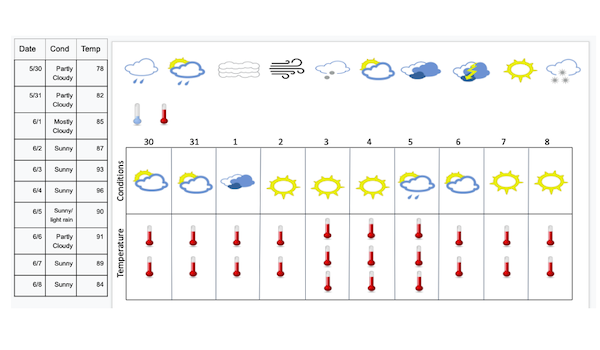
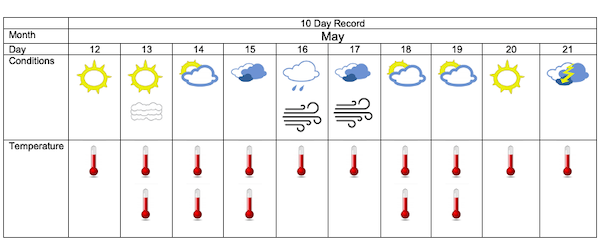
Every day for the next ten days (two school weeks) have students collect data including weather conditions and temperature. Use the icons to create a chart that records daily weather data. (See the charts on pages 13-15 of Utah OER SEEd textbook for an example.)
As the data accumulates, create a picture graph and/or a scaled bar graph to represent the data set. Compare the number of days with similar and different weather.
Weather Patterns
Teacher: Today we are going to musically model the weather information we collected by composing weather pattern songs.
Create a chart with weather information collected as a class like the one shown below if you haven’t already done so. This can be done by dragging and dropping the icons in the google slides or by arranging paper copies of the weather icons found in the Equipment and Materials section. (Or show the chart from pages 14-15 of Utah OER SEEd textbook.)
Teacher: What do you notice about the information recorded here? Do you see any patterns?
Listen for student responses.
Teacher: Yes, I see sunny, foggy, partly cloudy, cloudy, rainy, windy, and stormy conditions. I also see warm and hot temperatures. Look at this first icon: sunny. What words would you use to describe sunny weather? (Possible ideas include light, bright, happy, shining, clear, fair, and so on.)
Teacher: How could we make light, bright, happy, shining sounds with our voices, bodies, or things around us?
(Possible ideas include humming a short melody to make a shimmering/shining sound, creating a pattern of claps and snaps, playing triangles or other instruments that ring, or even singing the descriptive words.)
Allow students to share some ideas.
Teacher: Which of these ideas should we use in our composition?
Decide on one idea as a class to represent sunny weather.
 Teacher: We want to make sure we represent the temperature in a different way than the sun shining. What words would you use to describe a warm temperature? (Possible words: comfortable, pleasant, playful, feels nice.) How can we use these words to help us decide on sounds to represent the warm temperature?
Use any combination of body percussion, vocalizations, or sounds of objects from around the classroom that produce different sounds than the ones created for the sunny weather.
Teacher: Now, how can we make the hot temperature sound different from the warm temperature? What words would you use to describe hot? (Possible ideas include sweaty, need shade, sluggish, summer.) How can we use these words to help us decide on sounds to represent the hot temperature? What would make a sticky/sweaty kind of sound?
Continue to have students describe the weather icons using descriptive words, and then use those words to help guide students’ musical choices. At this point, you could continue as a whole group, or divide students into small groups to come up with words and sounds for the weather icons that have not been depicted yet. If dividing into small groups, assign each group a different weather icon (for example, group 1--fog; group 2-- partly cloudy; group 3--cloudy; group 4--windy; group 5--stormy). Give them 1-2 minutes to decide first on descriptive words for that type of weather, and then figure out musical sounds to represent that specific weather. Remind them they can use any combination of body percussion, vocalizations, classroom instruments, or sounds of objects from around the classroom.
Once all the weather icons have had sounds connected to them, have students perform the specific sound(s) for each icon as you point to the icons on the board.
 Teacher: We now get to put the sounds together to represent the weather data we collected. Our weather chart will become the musical notation for our composition. Music notation helps us know what sounds to perform at which specific time. We will start on the left of our chart and read across to the right. Since the sunny weather happens at the same time that the temperature feels warm, we will perform those sounds at the same time, like in an orchestral score. Do you see other sounds that will be performed at the same time?
As necessary, divide students into groups to perform different aspects of the weather if the students cannot simultaneously perform the multiple sounds themselves.
Conduct the students through their weather pattern composition by guiding students across the weather chart.
Teacher: What did you like about that performance? What went well? What do you want to change?
Apply suggestions as you perform the music again.
Teacher: Could you hear the weather patterns in our music? I could! We were being scientists by looking for patterns over time. Scientists that study weather are called meteorologists. Meteorologists analyze patterns of weather data from different times and areas so that they can make predictions about what type of weather might happen next. Why do you think they want to predict weather that will happen in the future? How will their predictions help us? We call these predictions “weather forecasts.” Meteorologists forecast severe weather so that communities can prepare for and respond to these events.
Look through weather patterns such as average temperature, number of days with rain, and so on in your local area. Weather Underground has a history tab that allows you to access daily, weekly, and monthly weather records for many locations with information back to 1930. Enter the location you want to research, and select the history tab.
Teacher: Looking at the patterns we’ve seen, you will now create a forecast composition in small groups.
Have students select a specific location/climate and a specific season/month. Have them create their weather forecast chart for a one-week forecast in the future.
 Teacher: A forecast means a guess of what you think the weather will be. We don’t have all the tools meteorologists use to make their weather forecasts, but we will do the best we can. Arrange the weather icons into a chart on what you think the weather will be for one week. Just like we did as a class, create sounds for each weather icon you use in your composition. You can choose to use any combination of body percussion, vocalizations, classroom instruments, or sounds of objects from around the classroom. Your weather forecast chart will be the music notation for your composition.
Note: Having students create forecasts for different seasons and different locations gives the class the opportunity to compare and contrast the patterns seen. To simplify, you might consider having students use the data from other months found in the charts on pages 13-15 of Utah OER SEEd textbook rather than coming up with their own forecasts based on past weather data.
Allow groups to perform their forecast compositions for the class.
Possible extension: Throughout the year, you could have students check the weather for the dates and locations for which they created their compositions to see if their forecasts were close to the actual weather.
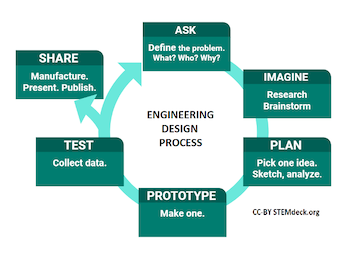 Show the engineering design process model and ask students how what we have done today fits in this model.
Teacher: Did we follow the engineering design process today? We did as we created weather pattern compositions. Now think about the science concepts we studied. How does gathering weather data and figuring out different ways to represent the weather patterns fit in the process of defining a problem, imagining (researching and brainstorming), planning, creating, testing, and/or sharing? What could we do next with what we have learned?
Learning Objectives
- Collect weather data.
- Create a music composition using vocalization, body percussion, and/or instruments.
- Perform in small groups.
Utah State Board of Education Standards
This lesson can be used to meet standards in many grades and subject areas. We will highlight some standards to give an example of application.
Grade K Music
- Standard K.M.CR.1: Explore music concepts of steady beat, timbre, and melody, and generate musical ideas using limited tone sets and simple meters.
- Standard K.M.CR.3: Organize musical ideas using iconic notation or recordings.
- Standard K.M.P.3: Develop these skills and concepts essential to music performance.
- Respond to the conductor to start, stop, and stay together.
- Standard K.M.CO.4: Explore and demonstrate learning in another content area through music.
Grade K Science with Engineering Education (SEEd)
- Standard K.1.1: Obtain, evaluate, and communicate information about local, observable weather conditions to describe patterns over time. Emphasize the students’ collection and sharing of data. Examples of data could include sunny, cloudy, windy, rainy, cold, or warm. (ESS2.D)
- Standard K.1.2: Obtain, evaluate, and communicate information on the effect of forecasted weather patterns on human behavior. Examples could include how humans respond to local forecasts of typical and severe weather such as extreme heat, high winds, flash floods, thunderstorms, or snowstorms. (ESS3.B)
Grade K Mathematics
- Standard K.MD.2: Directly compare two objects with a measurable attribute in common, to see which object has "more of"/"less of" the attribute, and describe the difference. For example, directly compare the length of two pencils and describe one as shorter or longer.
Grade 3 Music
- Standard 3.M.CR.1: Improvise rhythmic and melodic patterns and musical ideas for a specific purpose using a specific tone set and simple meters.
- Standard 3.M.CR.2: Select and demonstrate musical ideas to express intent while connecting to purpose and context, and organize personal musical ideas using iconic notation or recordings to combine and/or sequence personal rhythmic and melodic ideas.
- Standard 3.M.P.11: Perform music with expression, technical accuracy and appropriate interpretation; watch and respond to the conductor to perform dynamics and start, stop, and stay together; and demonstrate performance decorum.
- Standard 3.M.CO.1: Describe how music relates to personal, social, emotional, and intellectual development; use life experience and additional content knowledge to inspire and respond to music and deepen understanding of another content area through music.
Grade 3 Science with Engineering Education (SEEd)
- Standard 3.1.1: Analyze and interpret data to reveal patterns that indicate typical weather conditions expected during a particular season. Emphasize students gathering data in a variety of ways and representing data in tables and graphs. Examples of data could include temperature, precipitation, or wind speed. (ESS2.D)
Grade 3 Mathematics
- Standard 3.MD.3: Draw a scaled picture graph and a scaled bar graph to represent a data set with several categories. Solve one- and two-step "how many more" and "how many less" problems using information presented in scaled bar graphs. For example, draw a bar graph in which each square in the bar graph might represent five pets.
Equipment and Materials Needed
- Weather Pattern Composition google slides
- Songs and Poems about the weather:
- Weather icons
- Simple classroom musical instruments (optional)
Additional Resources
- 3rd Grade Utah Open Education Resource Science Textbook
https://emedia.uen.org/courses/utah-oer-textbooks-3rd-grade-seed/view - Kindergarten Utah Open Education Resource Science Textbook
https://emedia.uen.org/courses/utah-oer-textbooks-kindergarten-seed/view - Engineering Design Process
https://www.engineeringforkids.com/about/news/2020/march/importance-of-the-engineering-design-process/
Image References
Images 1-2: Heather Sundahl
Image 3: Emily Soderborg
Images 4-6: Heather Sundahl
Image 7: https://commons.wikimedia.org/wiki/File:Engineering_design_process.png
www.education.byu.edu/arts/lessons